

Skip the config files: Wizard-driven configuration means you deploy in minutes, not days.
Stop digging through text logs: Get stunning dashboards and advanced reporting that executives actually understand.
Built for teams: Enterprise-grade user management means you don’t have to share a single admin login anymore.
Keep your favorite engine: Nagios Core still runs the checks under the hood. XI gives you autopilot and a beautiful interface.
Deploy in minutes, free for 30 days. No credit card required.
Free and open source. Released under the GPL.
The monitoring engine. Schedules checks, evaluates results against your thresholds, and sends notifications on state change.
One agent across every supported platform, with a web interface for checking metric values before you build a check.
The official plugin set, including check_ping, check_http, check_disk, and check_ssh.
Each includes a 30-day fully functional trial.
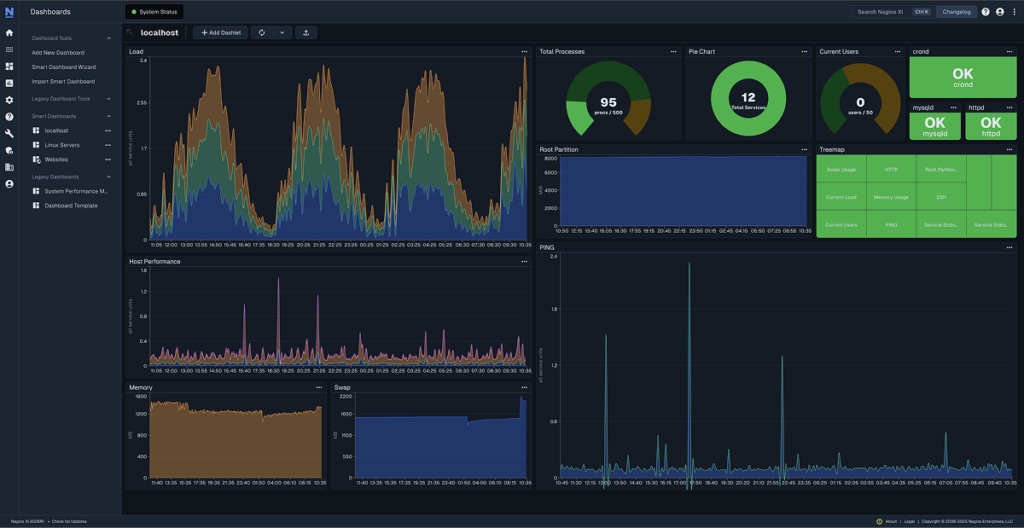
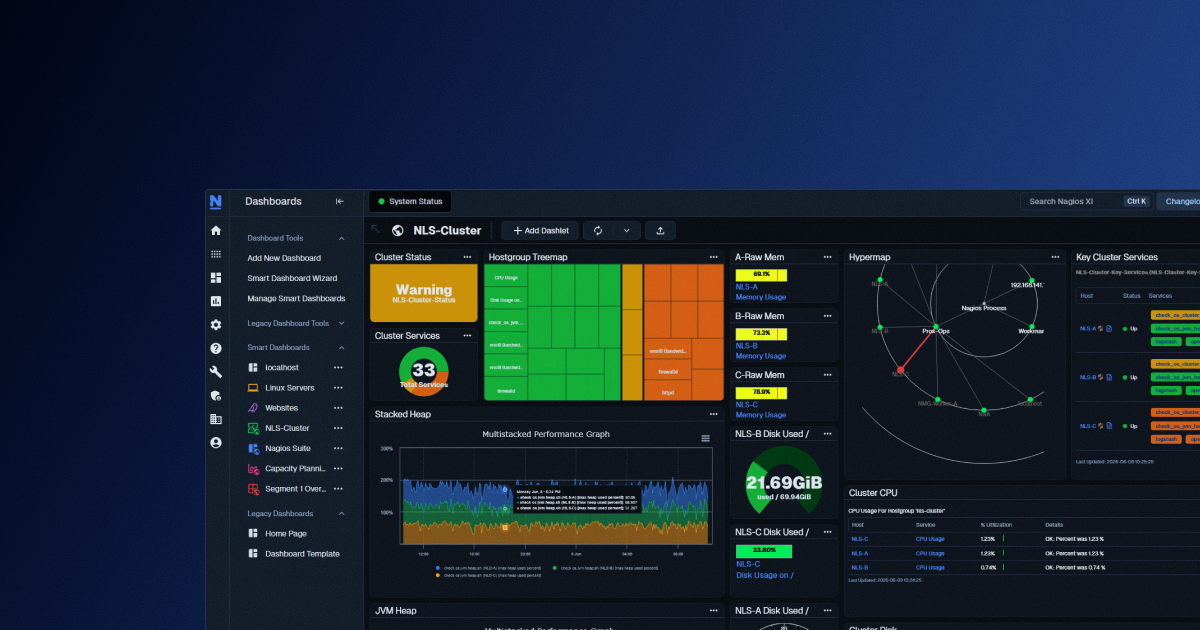
Configuration Wizards, dashboards, reporting, and user management on top of the Core engine.
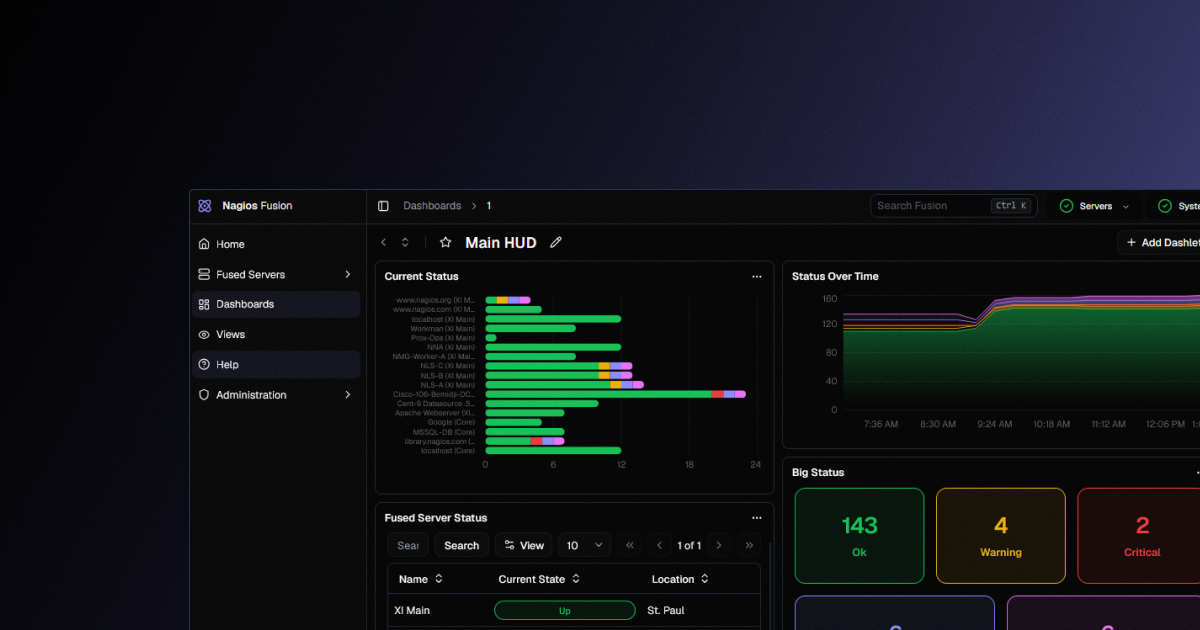
One interface across multiple Nagios XI and Nagios Core servers in separate locations.
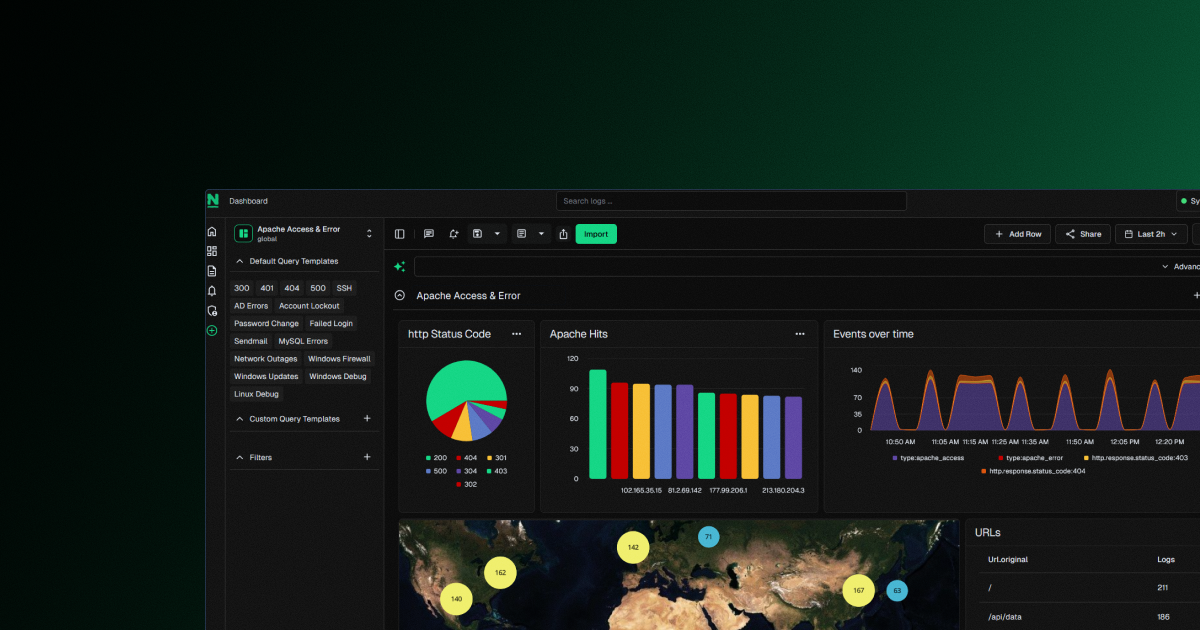
Centralize syslog, Windows event logs, and application logs. Search, alert, and set retention.
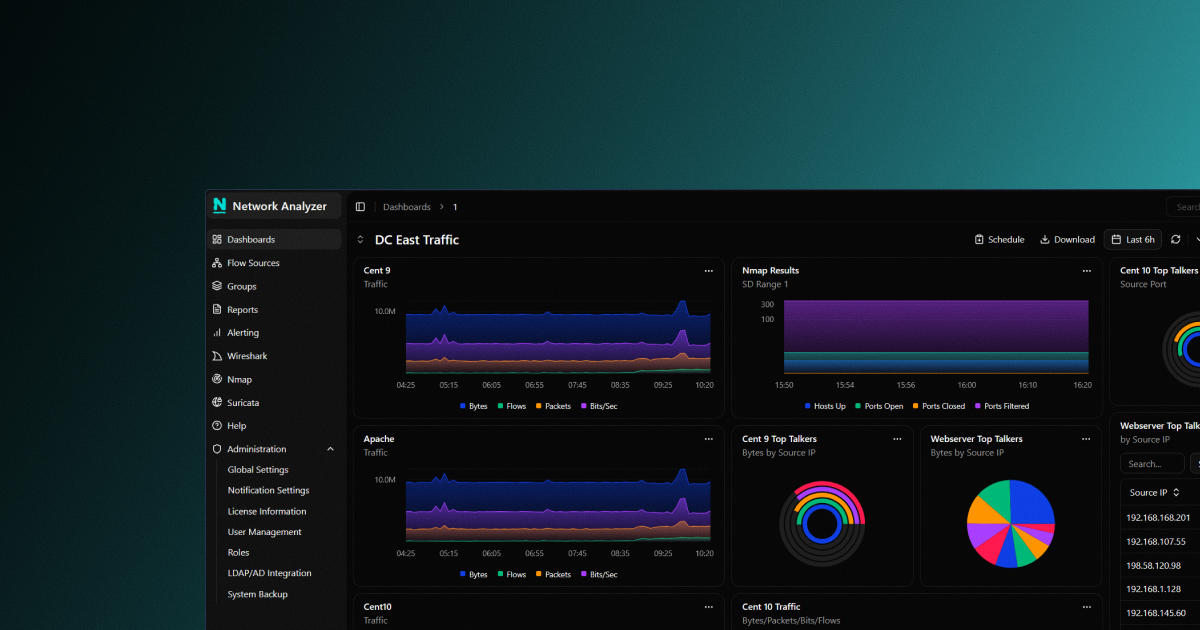
NetFlow, sFlow, J-Flow, and IPFIX analysis. See which conversations consume the bandwidth.
Tell us what you need to monitor and we will point you at the right starting place.
We will email your download access link.
Monitoring more than one site? Nagios Fusion puts multiple Nagios Core and Nagios XI servers behind one interface. See Fusion
We will email your download access link.
Monitoring more than one site? Nagios Fusion puts multiple Nagios Core and Nagios XI servers behind one interface. See Fusion
We will email your download access link.
Monitoring more than one site? Nagios Fusion puts multiple Nagios Core and Nagios XI servers behind one interface. See Fusion
We will email your download access link.
Monitoring more than one site? Nagios Fusion puts multiple Nagios Core and Nagios XI servers behind one interface. See Fusion