NCPA is packaged for most common platforms including Windows, Linux systems with RPM and DEB packaging, and Mac. Packaging is the one portion of NCPA that cannot be truly platform agnostic. However, having pre-built packages for NCPA allows for quick and easy installation and minimal dependencies. This documentation will give examples of how to get started using NCPA.
Installing on Windows
First, download the latest Windows installer to the system you are installing on. There are two types of installations you can do in Windows. The first install type is the graphical install which uses the standard graphical install with user prompts to adjust NCPA settings and writes the ncpa.cfg file for you. The second install type is a silent install which can be ran from the command line by passing your own settings in the command which can be useful when deploying NCPA on multiple systems.
Graphical Install
To get started right away, we recommend doing a basic graphic install first. Navigate to the location that the .exe was downloaded to and double-click the installer. After agreeing to the license terms, you will find a series of configuration screens. Each screen is shown below with setting explained.
The first thing you'll be prompted to do is accept the licensing agreement for NCPA. It's fairly straightforward. Once you agree and accept the license you'll continue on to the configuration steps.
Note: The configuration steps below are only shown on an actual install. If you have already installed an older version of NCPA you can upgrade by running the new versions installer. You will skip the configuration steps and use the same configuration you already had.
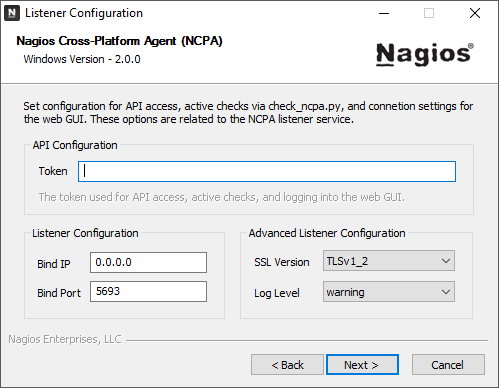
Step 1 - Listener Configuration
| API Configuration |
Listener Configuration |
Advanced Configuration |
|
Token - The token used for API calls (from Nagios XI config wizard, check_ncpa.py, curl, etc) and logging into the GUI.
|
Bind IP - The IP to bind to. Leaving it 0.0.0.0 will bind to all available.
Bind Port - The port to bind to. By default it binds to 5693.
|
SSL Version - Choose from TLSv1.0-1.2. Defaults to TLSv1.2.
Log Level - Should be set to warning unless you need more info for debugging purposes.
|
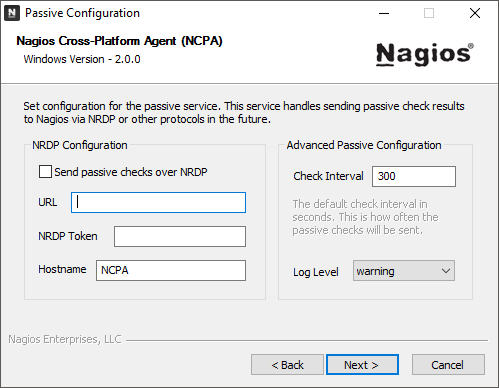
Step 2 - Passive Configuration
| NRDP Configuration |
Advanced Configuration |
|
URL - The URL to the NRDP server.
NRDP Token - The token defined on the NRDP server for receiving the passive check results.
Hostname - The value that will replace %HOSTNAME% in the passive check configurations.
|
Check Interval - The default check interval in seconds for passive checks. You can override this by setting a duration on the check itself.
Log Level - Should be set to warning unless you need more info for debugging purposes.
|
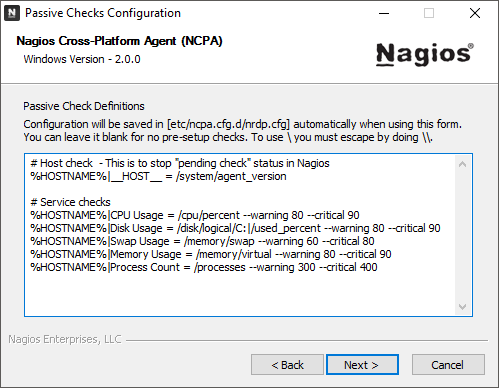
Step 3 - Passive Check Configuration (Optional)
| Passive Check Definitions |
|
If the send checks over NRDP check-box is selected, the NCPA installer will give a list of default passive checks that it will write into the ~NCPA/etc/ncpa.cfg.d/ directory as nrdp.cfg. You can also change these check definitions later.
|
Final Steps
Once you're done with configuration, you can set the location for NCPA to install and start the installation process. The installer will copy the files and create the NCPA services; one for the GUI, live stats, graphing, API, and active checks (NCPA Listener) and one for passive checks (NCPA Passive), and will start the services with the settings you specified during the install.
Skip to Using the Web GUI
Silent Install
An alternative to the graphical installer above is the silent install method. Silent install allows you use the NCPA installer from the command line. Doing so will let you pass config values directly into your initial ncpa.cfg before the first start of the NCPA service. This can be particularly helpful when deploying on a large number of machines.
In order to use the silent install, you must pass the /S value to the install as shown below.
The /D command is optional, must be the last argument, cannot contain quotes, and must be an absolute path.
ncpa-<version>.exe /S /TOKEN='mytoken' /<variable>='<value>' /D=<base directory>
The above command would set the token in your ncpa.cfg to mytoken. The silent install will install and start the NCPA listener and passive services. That's all you need to do. Below is a reference of all available configuration options for the silent install.
Skip to Using the Web GUI
Available Silent Install Configuration Variables
Note: These variables correspond to locations inside your ncpa.cfg and can be changed at any time. Variable names are case sensitive and must be in all capitals.
| Variable |
Description |
| TOKEN |
Required The token for the web GUI, check_ncpa.py, and accessing the API.
Windows cmdline uses ^ to escape, to use it in your token you must escape it as ^^
|
| IP |
The IP address to bind to. Default is 0.0.0.0 which is all IPv4 addresses. IF you'd like to connect to IPv6 you must use ::. |
| PORT |
The port to bind to. The default is 5693. |
| NRDPURL |
The URL to the NRDP server you'd like to send passive checks to. Setting an NRDP URL will make NCPA automatically start sending the default passive checks after install.
Do not set the NRDP settings if you'd like just the active agent. |
| NRDPTOKEN |
The authentication token for the NRDP server. |
| NRDPHOSTNAME |
The hostname you want to send to the NRDP server with each service check. |
Installing on Linux
We build for a variety of linux types, so you will need to verify if you are using a RPM or DEB based Linux distro. You can view the RPM install for CentOS/RHEL, Fedora, SUSE, etc or DEB install which covers Debian and Ubuntu.
Installing on RPM-based Linux
Download the latest RPM package for the operating system of your choice. If you are using CentOS or RHEL we recommend using the Nagios RPM repository to install NCPA.
If you are not using the RPM repository (not using CentOS/RHEL or want to manually install) download the RPM file to your /tmp directory and run the following to install the RPM package using the rpm command. You could also install a local package using yum or similar but we won't use those in this example.
rpm -ivh /tmp/ncpa-<version and arch>.rpm
For SLES and OpenSUSE specifically, ncpa depends on insserv-compat, so your install command should look like:
zypper install insserv-compat ncpa -y
Now that it's installed, you should do the initial configuration.
Skip to Initial Configuration on Linux
Installing on DEB-based Linux
Download the latest DEB package for Ubuntu or Debian. Download the package into your /tmp directory. You can use any package manager you want, but for this example we will be using dpkg command. Run the command below to do the full install of NCPA:
dpkg -i /tmp/ncpa-<version and arch>.deb
Now that it's installed, you should do the initial configuration.
Skip to Initial Configuration on Linux
Initial Configuration on Linux
By default the token will be set to mytoken and you will want to change this right away since it allows authentication into the web GUI and access to the API. To change it, open up your NCPA configuration file /usr/local/ncpa/etc/ncpa.cfg and edit the following config section:
[api]
community_string = <your new token>
You must make sure that the community_string value is under the [api] section for it to work. After saving the changes, restart the NCPA listener service:
/etc/init.d/ncpa restart
The service should stop and start without errors. You are now ready to start using NCPA.
Skip to Using the Web GUI
Installing on Mac
At this time, the installation on Mac requires root permissions (can be done via sudo) and needs to run using the cmdline. First download the latest DMG file and mount it. Then run the following command:
sudo zsh /Volumes/NCPA-<version>/install.sh
Unlike Windows installer there is currently no "click and go" installation method. However, the script handles both install and upgrades. It does the following for you:
- Creates the nagios user and nagios group (if necessary)
- Creates the /usr/local/ncpa directory (if necessary) and move all NCPA files to that location
- Sets permissions on /usr/local/ncpa to nagios:nagios and 775
- Sets up services that auto-start for both Listener and Passive services and manually starts them
Once successfully installed, you can unmount the NCPA installer and continue to the web GUI.
Skip to Using the Web GUI
Installing on Solaris
Download the latest Solaris package into the /tmp directory and run the following command:
pkgadd -d /tmp/ncpa*.pkg ncpa
The system should immediately start installing NCPA and all of it's components. The default location is /usr/local/ncpa. Wait for it to exit, and continue to configuration.
Skip to Using the Web GUI
Installing on AIX
Download the latest rpm for AIX into the /tmp directory and run the following command:
rpm -ivh /tmp/ncpa-<version and arch>.rpm
We currently build our AIX package with AIX 7.1 however this package can install on any AIX 7.x system. If rpm complains about the Operating Systems not matching, use --ignoreos.
If you are using AIX 6.x, it is no longer supported and you will have to use NCPA version 2.1.1.
Skip to Using the Web GUI
Using the Web GUI
Once NCPA has been successfully installed. Verify that the GUI works by navigating to https://localhost:5693/ on the computer you installed NCPA on. If you've installed NCPA on a server with no GUI, use the IP address/port combo instead. The NCPA installer does not change any firewall configurations on Linux or Mac; you may need to configure it.
Note: NCPA does not automatically modify the firewall on Linux or Mac OSX. The Windows installer will open the port specified by default. However, on Linux you will need to manually verify the port that you will be using to connect to NCPA with. By default the NCPA port is 5693 and can be edited in ncpa.cfg.
To log into the web GUI, use your token that you set during install. Later on you can configure NCPA to lock the web GUI with an admin password and disable access to it using the token. Once inside the GUI you'll see a main dashboard with a little bit of information about the system the NCPA is running on.
Take your time and play around with the GUI. There are a lot of useful features that can help you get an idea of what NCPA can monitor for you. Don't worry if you don't see everything you want to monitor in the API, you can run your own custom plugins too.
In the GUI you will see the tabs for:
-
Dashboard
The main page of the GUI with a bit of information about the currently running NCPA process and the operating system it's running on.
-
Checks
A new section in NCPA 2 that allows you to see the checks that have been performed on the NCPA agent and from where. By default it only shows the last 30 days of check data.
-
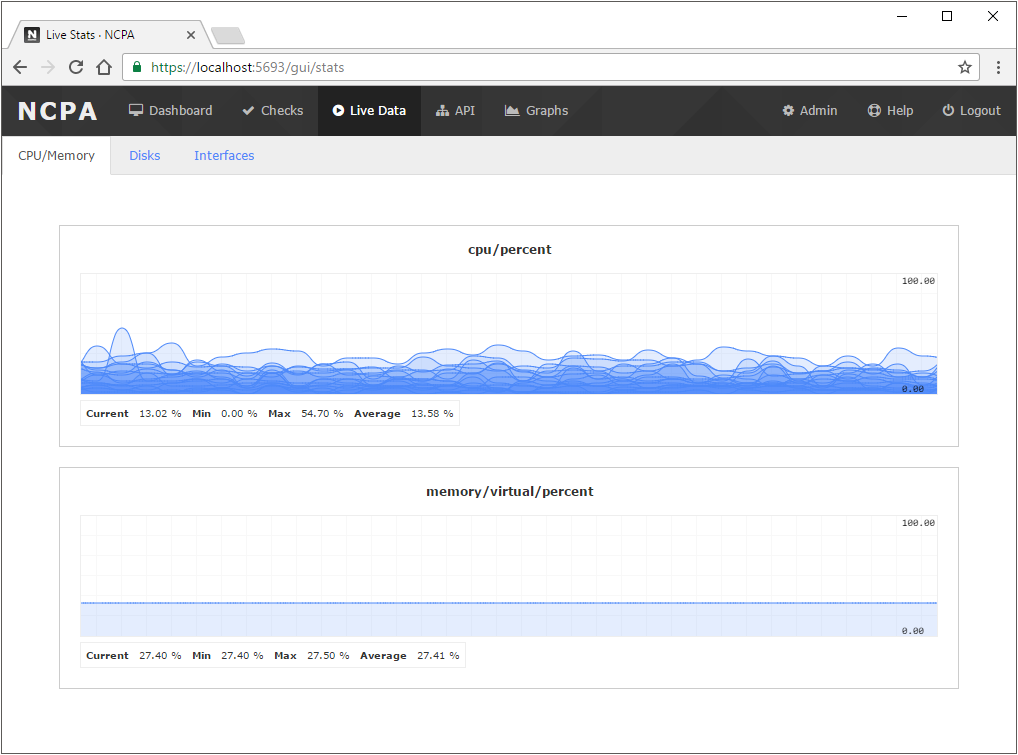
Live Data
A full set of live data graphs using websockets. These are real-time graphs showing things like CPU usage, memory usage, and bandwidth. These are examples of the graphs that can be created and embedded using the graph generator in the Graphs tab.
- Stats Graphs - Live data graphs of CPU, memory, interface bandwidth, and disk usage.
- Tail Event Logs - (Windows only) Will tail the event log and show incoming logs in a table.
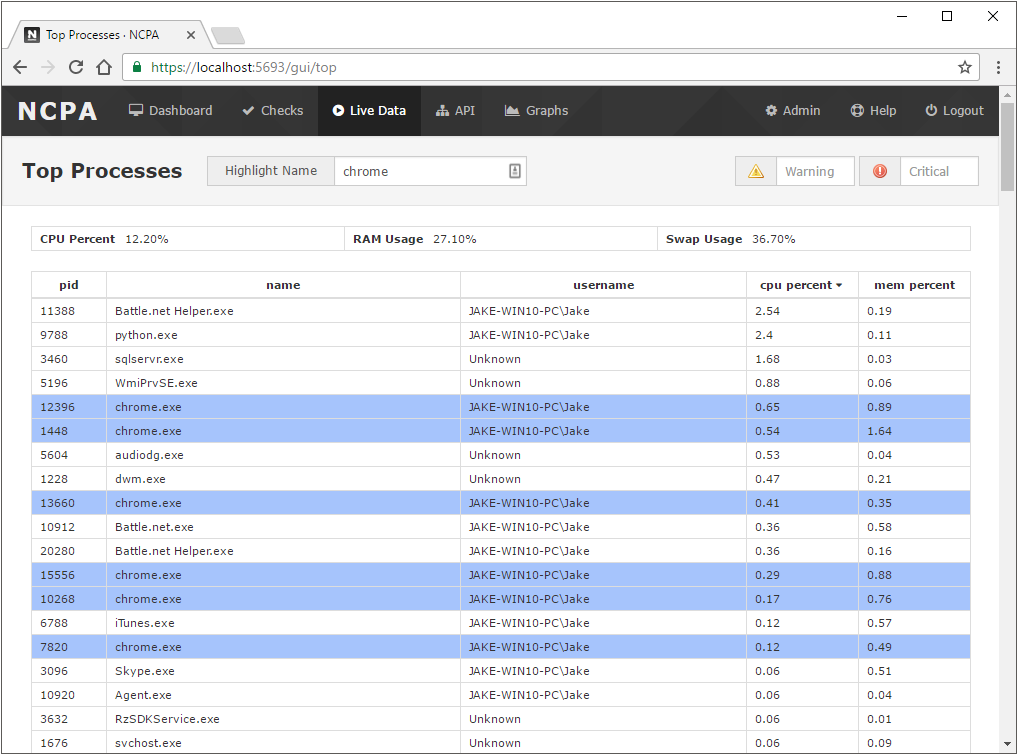
- Top Processes - A live feed of the current processes running. This is like
top on linux.
-
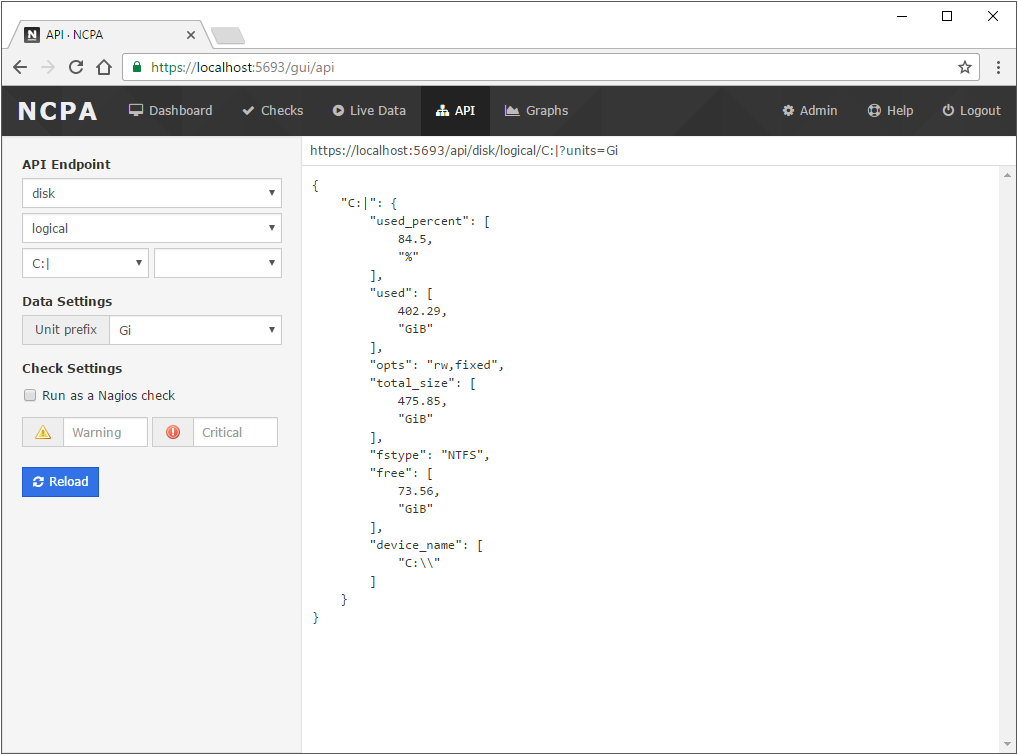
API
The API browser allows you to view the different sections of the API in a structured way. This is extremely helpful when trying to visualize what data you need to get with a check. You can also get help creating your active and passive check definitions by using the "view as..." functionality.
-
Graphs
The graph generator allows you to select an API endpoint to make a real-time websocket graph of. These graphs can be embedded and use the API to pull data from NCPA.
-
Admin
You can view your NCPA configuration. The admin section is still being worked on and is currently read-only. You can also lock it down with some configuration settings if you'd like to hide this section.
-
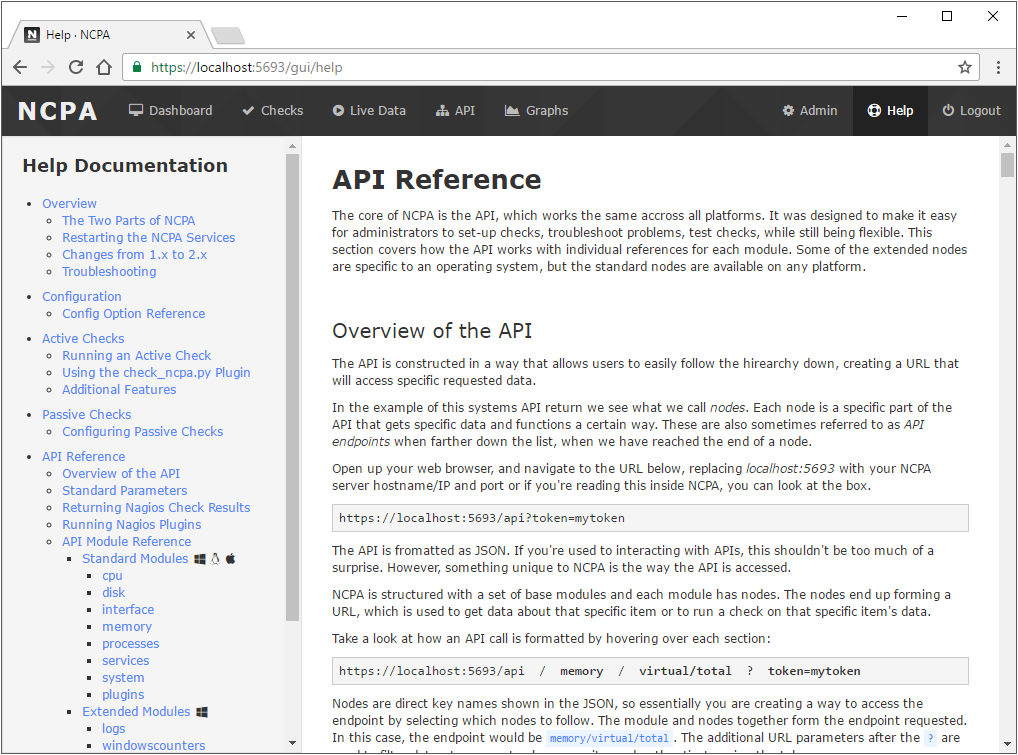
Help
The help section has documentation on how to configure, create active and passive checks, and manage your NCPA installation. Each NCPA installation comes with a copy of the full NCPA reference documentation to make it easier to find the information you're looking for while working with NCPA.
Now that you've got to explore some of the features in the GUI, let's start monitoring some services.
Start Monitoring
Now that you have NCPA installed, let's start monitoring something. This document will not go into too much detail on how to configure your Nagios Core/XI but it will show you how the active check is created and how you can set up passive checks to send to your NRDP server.
Find our what you want to monitor
Knowing what you want to monitor will help you figure out what sort of checks you will need NCPA to perform. This could include your own custom plugins - or just data that NCPA can get itself. That is entirely up to the end user. For this example we will monitor the following using only NCPA built-ins:
- CPU Usage
- Memory usage
- Total Process Count
There are many more endpoints, but you can read the help documentation to see more options.
Decide the kind of check to use
Once you've decided what to monitor, you can choose how to monitor it. There are two types of checks you can use. Active checks are ran using a plugin on the Nagios Core side, which will put most of the load on the server. If you have a lot of checks and want to move some of the load or you have a system that sometimes drops connections, you might want to use a passive check. Passive checks run on the client side and send the check results to Nagios Core for processing. NCPA can do both kinds of checks, so it's up to you to choose.
Active Checks (check_ncpa.py)
One of the easiest ways to start monitoring using active checks is by running the NCPA configuration wizard in Nagios XI. However, we will not go over how to set these up since the wizard walks you through the steps to start monitoring right away. It will give you default values, default checks, and allow you to configure what type of active checks you'd like to be performed.
For those of you without Nagios XI, below is going to cover some basic information on how to create services for a host in Nagios Core using check_ncpa.py just like the wizard in nagios XI would do for you.
Downloading check_ncpa.py
If you're using a standard install of Nagios Core, start by downloading the check_ncpa.py plugin into the plugin directory, normally /usr/local/nagios/libexec. The plugin works with Python 2.x and 3.x so you shouldn't have any problems running it on your Linux distro of choice.
Create the check command definition
Create the check_ncpa command in your configuration files for Nagios Core, normally they are located in /usr/local/nagios/etc - you may have a commands.cfg file you will want to put this command in. The command below will allow us to pass most of the arguments in with $ARG1$, allowing it to be more dynamic.
define command {
    command_name    check_ncpa
    command_line    $USER1$/check_ncpa.py -H $HOSTADDRESS$ $ARG1$
}
Create Nagios checks
You can create the checks in a config file in /usr/local/nagios/etc. For this example we will create a config file called ncpa.cfg with the following defined:
define host {
    host_name               NCPA 2 Host
    address                 192.168.1.10
    check_command           check_ncpa!-t 'mytoken' -P 5693 -M system/agent_version
    max_check_attempts      5
    check_interval          5
    retry_interval          1
    check_period            24x7
    contacts                nagiosadmin
    notification_interval   60
    notification_period     24x7
    notifications_enabled   1
    icon_image              ncpa.png
    statusmap_image         ncpa.png
    register                1
}

define service {
    host_name               NCPA 2 Host
    service_description     CPU Usage
    check_command           check_ncpa!-t 'mytoken' -P 5693 -M cpu/percent -w 20 -c 40 -q 'aggregate=avg'
    max_check_attempts      5
    check_interval          5
    retry_interval          1
    check_period            24x7
    notification_interval   60
    notification_period     24x7
    contacts                nagiosadmin
    register                1
}

define service {
    host_name               NCPA 2 Host
    service_description     Memory Usage
    check_command           check_ncpa!-t 'mytoken' -P 5693 -M memory/virtual -w 50 -c 80 -u G
    max_check_attempts      5
    check_interval          5
    retry_interval          1
    check_period            24x7
    notification_interval   60
    notification_period     24x7
    contacts                nagiosadmin
    register                1
}

define service {
    host_name               NCPA 2 Host
    service_description     Process Count
    check_command           check_ncpa!-t 'mytoken' -P 5693 -M processes -w 150 -c 200
    max_check_attempts      5
    check_interval          5
    retry_interval          1
    check_period            24x7
    notification_interval   60
    notification_period     24x7
    contacts                nagiosadmin
    register                1
}
Replace the -t 'mytoken' with your own token. This will tell Nagios to perform active checks and will create a host called "NCPA 2 Host" with checks for CPU Usage, Memory Usage, and Process Count.
Restart Nagios and wait for active checks
Restart the Nagios service and you should see pending hosts/services appear. Once they do their initial checks, you should see your NCPA data in Nagios.
Passive Checks (NRDP)
In order for passive checks to work, you have to configure your passive service to actually send the checks. By default in new installs of NCPA 2, no passive handler is configured. If you installed on Windows and set up NRDP during the install process then you will already have a configuration set up. However, it would be a good idea to take a closer look at your configuration just in case.
Add checks to your ncpa configuration
Add a new NCPA configuration file to the ncpa.cfg.d directory located in the base NCPA installation directory. Use the following outline for passive checks to send to the NRDP server of your choice.
[passive checks]
%HOSTNAME%|__HOST__ = system/agent_version
%HOSTNAME%|CPU Usage = cpu/percent --warning 60 --critical 80 --aggregate avg
%HOSTNAME%|Memory Usage = memory/virtual --warning 80 --critical 90 --units Gi
%HOSTNAME%|Process Count = processes --warning 300 --critical 400
By default, passive checks are ran on 5 minute intervals, however with NCPA 2 you can now define a check interval in seconds by appending |interval to the left side of the passive check definition. An example of a CPU check that would be performed every 30 seconds is below:
%HOSTNAME%|CPU Usage|30 = cpu/percent --warning 60 --critical 80 --aggregate avg
Configure your NRDP settings
Get your NRDP settings. If you're using Nagios Core, you can install NRDP manually. Nagios XI has NRDP installed by default. We will focus on Nagios XI in this configuration. Go to your Admin section, under Inbound Transfers you can set your authentication token and get your NRDP URL.
Once you have your settings. Edit your ncpa.cfg file to look something like the following:
[nrdp]
parent = http://<nrdp address>/nrdp/
token = nrdptoken
hostname = NCPA 2 Host
Enable the nrdp handler in the [passive] section of your config:
[passive]
handlers = nrdp
Restart the NCPA Passive service
Depending on what operating system you are using, restart the ncpa_passive service.
You should start receiving passive check results immediately after the service has been restarted. A service restart is always required when making changes to the passive check configuration.
The first time the Nagios XI Server receives an Passive Check, it has to be configured and after it gets configured, you will see it in the XI web interface.
To configure it, login to XI and go to the Admin > Unconfigured Objects menu.
Click on the Blue Arrow to configure the Passive Check and fill in the information.
After it is finished, you should see it in the XI web interface waiting for the next check to run and update the statuses.
Other Documentation
We've gone over the basics of how to get your NCPA installation set up and briefly described how to create an active and passive check. There is a lot you can do with NCPA and there is a lot of documentation on how to do it. Below are some links to other documentation: